Last Updated on December 31, 2022 by tabraiz579
In statistics, we have to deal with a large amount of data, often large amounts of various kinds of data. Whenever we are dealing with different data, we are required to associate those data with one another to study the variations and effects of change in one due to another variable. This is called correlation.
- Correlation is a systematic study of the relationship between two variables.
- Correlation analysis gives information about the direction of change in one variable due to the change in another variable.
- It measures the intensity of the relationship or association among the variables.
- Measures in dependency of statistical variables.
- It does not necessarily imply the causation of anything, whereas causation mandatorily implies correlation.
In this article, we shall discuss correlation and its coefficient.
What is Correlation in Statistics?
The measure of the degree of dependence of one variable on another is called correlation. There are three main types of dependence:
- Positive dependence
- Negative dependence
- Zero dependence
Positive dependence:
A relationship between two variables in which change in one variable corresponds to the change in another variable in the same direction. For example, the sale of ice cream increases with an increase in weather temperature. Thus, positive correlation means if there is an increase in the value of one variable, it tends to grow in the value of another variable and vice-versa.
Negative dependence:
A relationship between two variables in which change in one variable corresponds to the change in another variable in the opposite direction. For example, if the price of a commodity increases, sales of that product decrease. Thus, negative correlation means if there is an increase in the value of one variable, it tends to decrease in the value of another variable and vice-versa.
Zero dependence:
There exists no relationship between given variables. A change in one variable does not affect the other variable. For example, the sale of four-wheelers does not have an impact on the number of deaths due to drowning. These types of variables come under zero correlation.
Learn further classification of types of correlation here.
How to Measure the Extent of Relationship?
The correlation coefficient determines the extent of correlation among two variables, whose value varies from –1 to 1 and is denoted by r. The value of r gives the exact degree of dependency of one variable on another. If the value of r > 0, then the correlation is positive. If the value of r < 0, then the correlation is negative.
- If r = 1, this is a case of perfect correlation; the data points are very close and lie approximately on a line. There is a positive dependency among variables. An increase or decrease in one variable corresponds to the same amount or proportionate change in the other. For example, more hours of workout helps burn more calories.
- If r = 0, this is the case of zero correlation; the data points are scattered unsystematically. The variables have no dependency on each other.
- If r = –1, this is the perfect negative correlation; again, the data points are so lying that they are almost linear, but the slope of this line is negative. There is a negative dependency among the variables; if one quantity increases, another decreases.
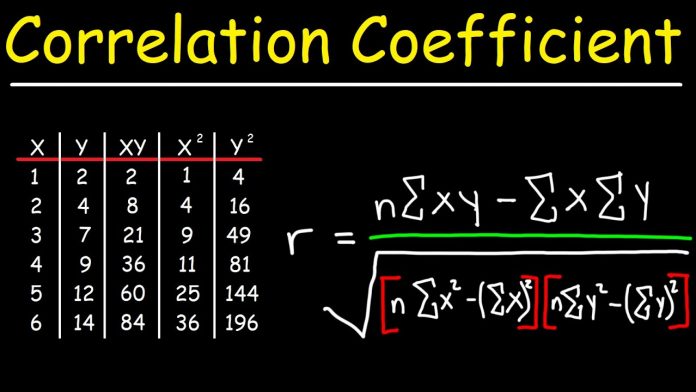
There are many types of correlation coefficients to examine which type of coefficient we need to calculate; first, we have to plot a scatter plot graph. If the scatter plot graph is linear, we calculate Karl Pearson’s coefficient of correlation, also known as the product-moment correlation coefficient or simple correlation coefficient, which gives precise linear dependency among x and y variables.
Learn the Pearson’s correlation coefficient formula here.
Properties of the correlation coefficient are:
- It has no unit, and it is a purely real number.
- The sign of r represents the direction of the relationship (positive or negative).
- The value of r ranges strictly between –1 and 1; any value outside this range indicates an error.
- Shifting of origin or change of scale does not affect the value of r.
- If r = 0, the variables are not linearly correlated.
The low value of r (close to zero) implies weak linear relation, whereas the high value of r (close to –1 or 1) represents strong linear relation.
Apart from that if you want to know about Vastu and Personality Development then please visit our Education category


